Anthropic has introduced Claude Dashboards and Claude Motion. For a finance team, the useful change is not prettier charts. It is the chance to move from a question to a view that can be inspected—and then explain an approved result without rebuilding it in another tool.
The two features do different jobs. Dashboards turns questions about connected company data into charts that refresh as the source changes. Motion turns supplied content into an editable animation that can be exported as an MP4. Both are in beta. Dashboards is available on paid Claude plans; Motion is available on Team and Enterprise plans, subject to organization settings.
Start with the number, not the animation
Anthropic says each Dashboard chart exposes the query behind it and shows when the data was last refreshed. That is useful for finance, but a visible query is not the same as a reconciled report. Before sharing a chart, check:
- Scope: Which entity, client, accounts, and reporting period does it cover?
- Definition: Does “revenue,” “cash,” or “margin” match the measure your team uses?
- Freshness: When was the source last updated, and what changed afterward?
- Tie-out: Does the figure agree with the approved report or system of record?
For example, a monthly revenue chart might look right while mixing two entities, using invoice dates instead of recognized revenue, or excluding refunds. A reviewer should catch that before the chart becomes a board slide.
Where MosoFin fits
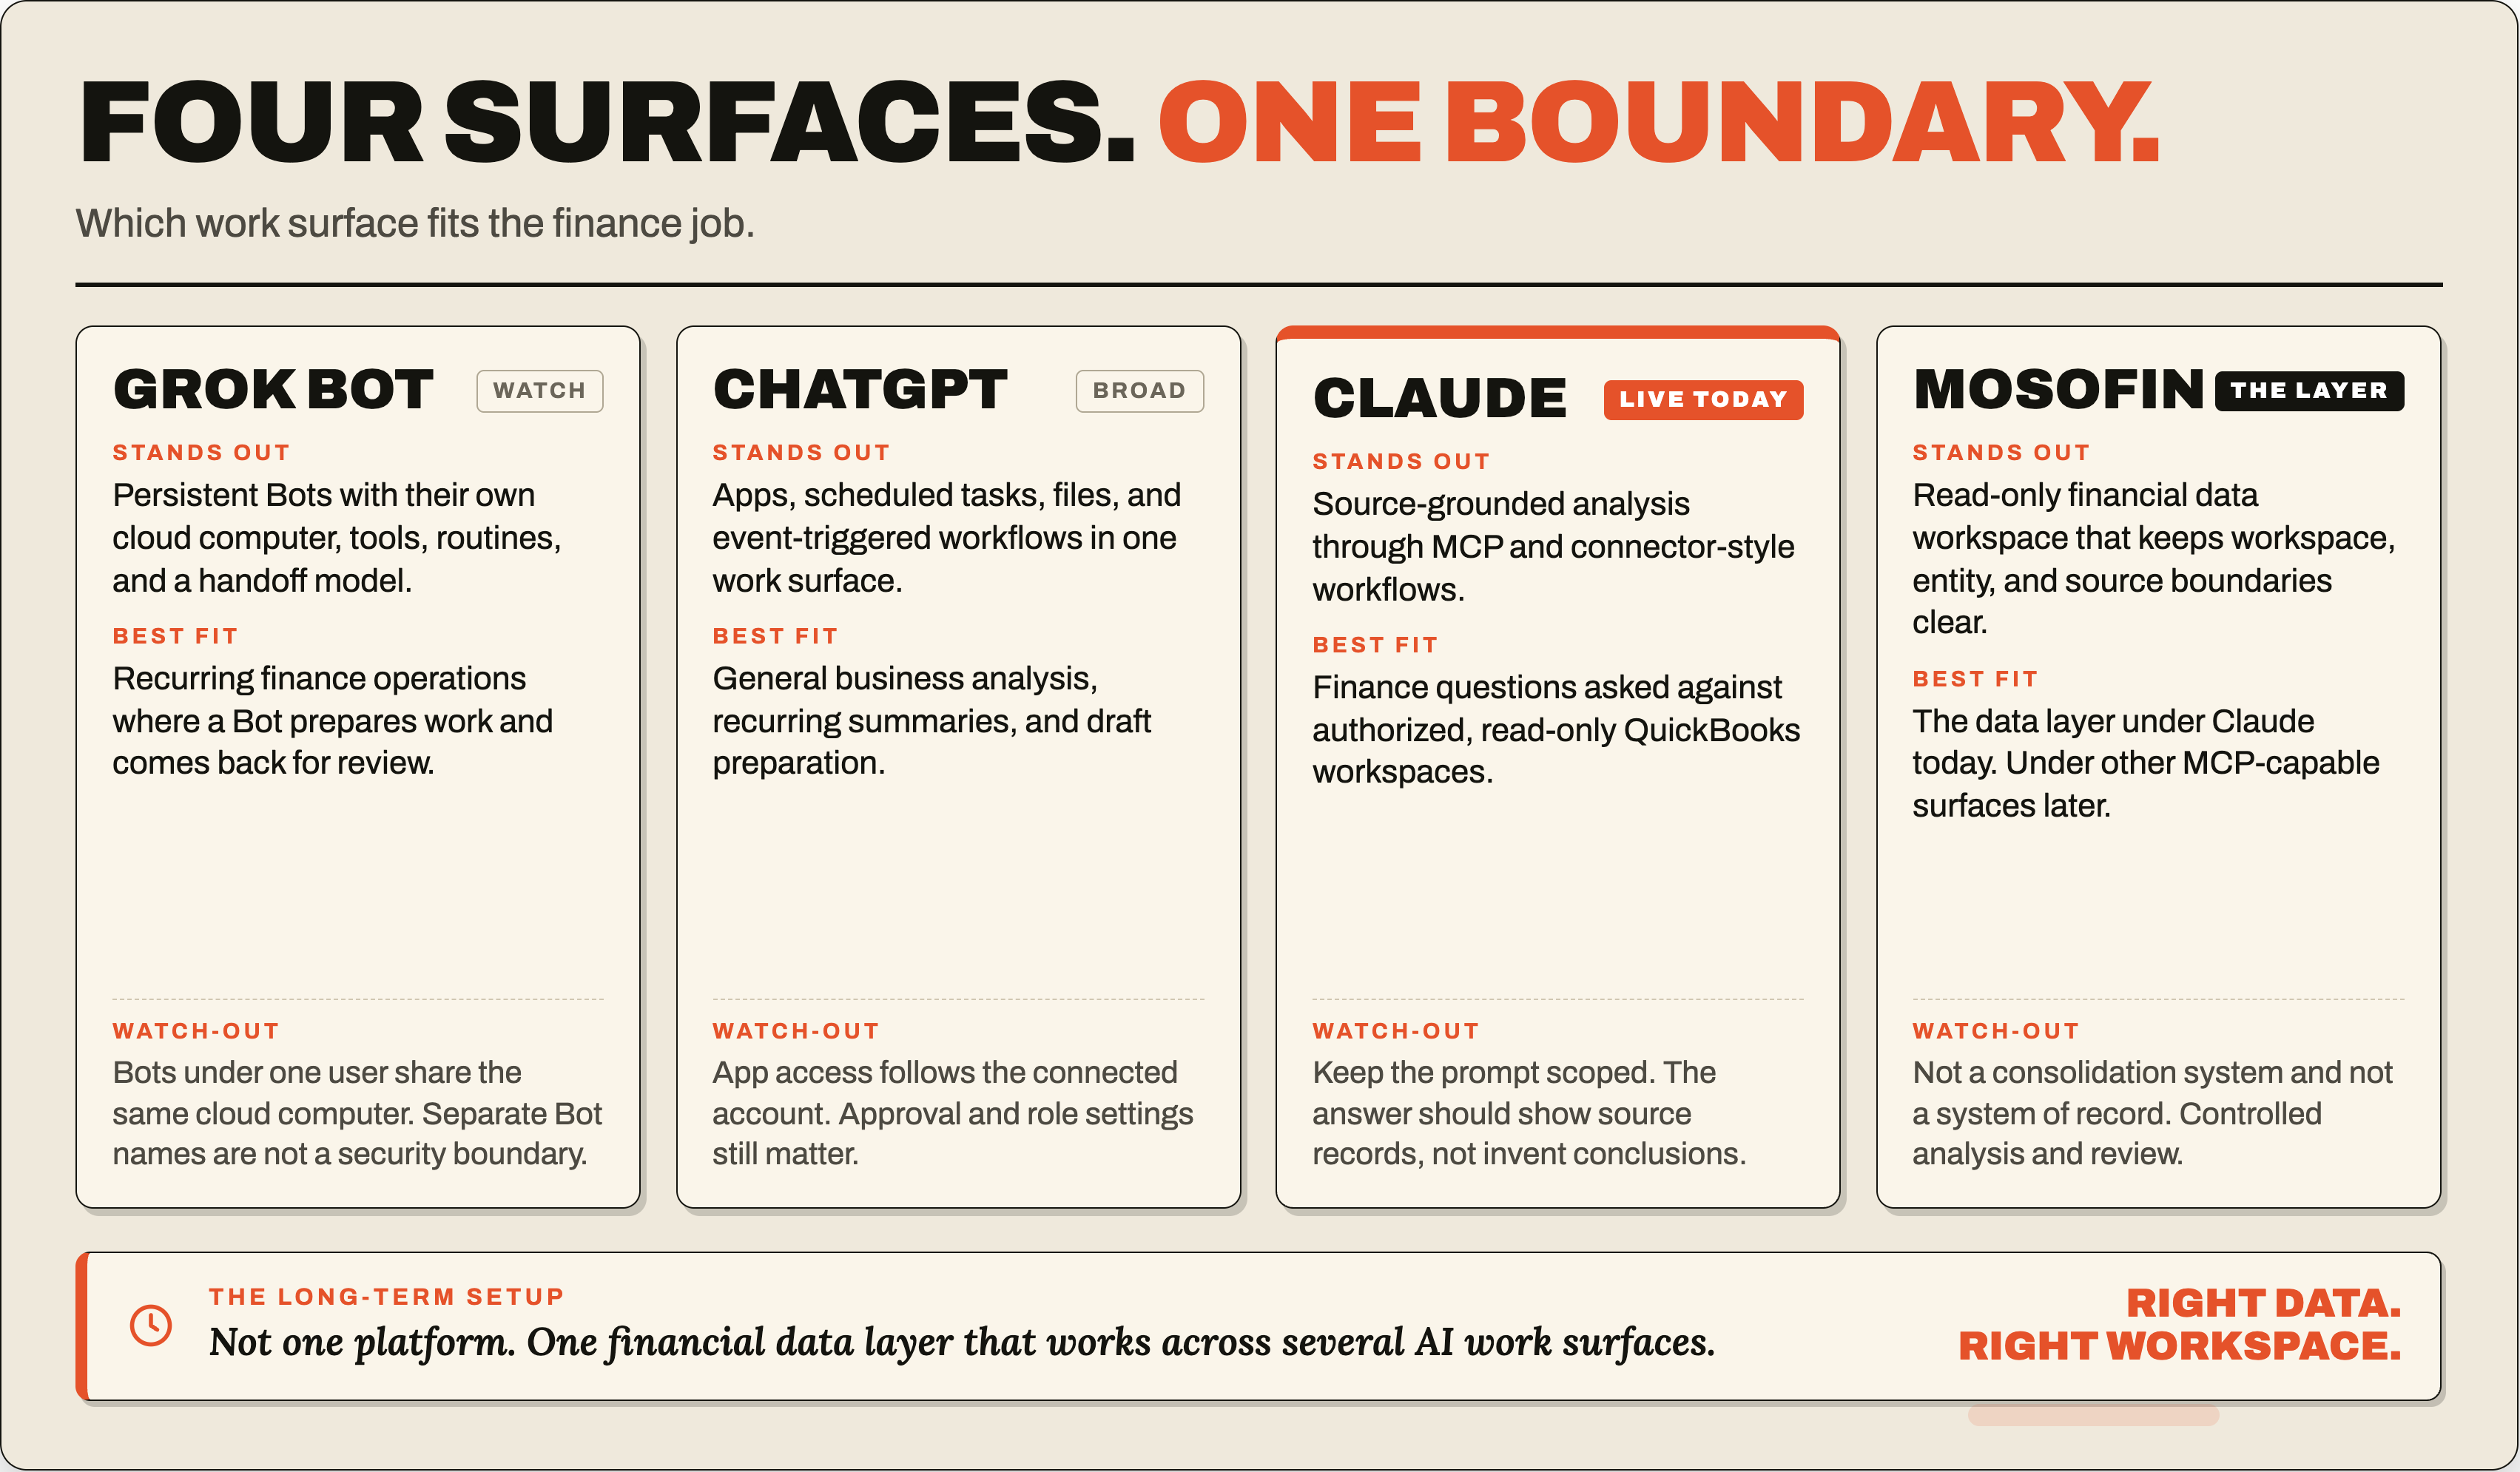
MosoFin’s Claude connection is a separate, read-only route to authorized financial data. A client or entity can have its own workspace, and a reviewer can ask questions across the workspaces they select. MosoFin does not change the underlying books.
That is not a claim that Claude Dashboards connects directly to MosoFin. Anthropic documents Dashboard connections to data platforms such as BigQuery and Snowflake, plus supported apps. We have not verified a direct MosoFin-to-Dashboards path. Use the documented MosoFin connector for conversational review; use Dashboards with a data connection your Claude account actually supports.
The same review discipline applies to either path: name the workspace or source, check the period and totals, and keep the evidence behind each explanation. Our how-it-works guide explains the MosoFin workspace model.
Use Motion after the review
Motion can turn an approved chart or summary into a short explainer—for example, a 30-second account of why cash fell while sales rose. Anthropic says the animation is editable and downloadable as MP4. It does not validate the accounting behind the words or numbers.
Before exporting, remove information the audience should not see, confirm every figure against the approved report, and have a responsible person sign off on the interpretation. A polished animation can spread an incorrect conclusion faster than a spreadsheet.
For a first test, use one entity and one narrow question: “What changed in revenue and gross margin this month?” Review the source figures and calculation, write the explanation, then animate only the approved version. Keep the underlying report alongside the MP4 so viewers can trace the story back to the numbers.
Sources and further reading
- Anthropic: Build live dashboards and animate explainers with Claude
- Claude Help Center: Get started with Claude Dashboards
- Claude Help Center: Get started with Claude Motion
- MosoFin: Connect MosoFin to Claude
- MosoFin: Read-only access and security
Frequently asked questions
Can Claude Dashboards connect directly to MosoFin?
A direct integration has not been verified. MosoFin’s documented Claude connector supports read-only questions about authorized workspace data in a conversation. Claude Dashboards has its own supported data connections.
Does Claude Motion verify the numbers in an animation?
No. Motion presents the content you provide. Check its figures, source, period, and explanation before sharing the MP4.